What are we doing about big data?

The one question I hate to hear asked is “What are we doing about Big Data“?

Seriously, what are we doing about Big Data? There is no right answer to this question. What have you been doing with your data all along? Nothing? Managing it in silos?

No one should be asking “What are we doing about big data?”

The question is “How can we better exploit the data we have to improve our bottom line?”

Big Data is not an amorphous cloud. You might not even be a big data shop – are you really generating that much data? How much of it are you marrying together? What do you want to get out of it? Do you still expect to summarise it on a PowerPoint slide deck?

If someone were to ask me now, what are you doing about big data, here is what I would say first:

  • What are you doing with the data you already have?
  • Have you got someone with an overview on all the data you have?

A lot of companies have neither, to be honest, and there is very little you can do with data if you do not have that overview. This – incidentally – is why data science is sexy. A data scientist isn’t someone who plays with big data – it’s someone who plays with all your data and does things with it you might not have imagined for the simple reason that, for example, all your data stream are kept separately.

If you have not got someone with a company wide overview, are you prepared to put someone in place who is not department specific? Someone who has access to all your data, and not just the data of one department? Are you going to break down the silos for your data?

Big data has a rather movable definition, but the definition I tend to work off is Hilary Mason’s: it’s data that one machine cannot handle on its own. After that, the worth is not in that it’s big, or you have a lot of it, but in what you do with it. I hate the word, but how you leverage it. The creativity does not lie in the extent of the data but the vision applied to it.

So, the next time someone asks, what are we doing about big data, what are you going to say?
 

Datascience job twitter feed for Ireland

I’ve started a datascience twitter feed for Ireland. Mainly I’ve done it out of frustration that there isn’t one and that searching for them isn’t always straightforward and also because that’s my own area of interest.

I’m particularly interested in those jobs with datascientist as their job title; I will consider other titles on a case by case basis – in particular if you’re looking for a data analyst to run simple reports, that won’t get listed here. I will look at machine learning related options and I will consider PhDs in the area of analytics and machine learning if you’ve gone one. Key requirement is that they be based in Ireland.

The twitter feed is here: http://www.twitter.com/datascience_ie and if you’ve got one, either DM a link to the description to me or send a link via email to datascience [at] treasalynch.com

Wedding Magazines and other thoughts.

Here’s some random information which might be worth looking at in some more detail.

On Saturday, I counted – sad person that I am – the number of wedding magazines on sale in Easons in Heuston Station. I did this basically because Irish Rail hadn’t told me what platform my train was going from, I didn’t feel like getting some food, and I was hanging around. There was a large display of them just inside the door. So easy to count and so attractive to do so when there seemed to be rather a lot of them.

So I can tell you the answer that I came up with was 13. I suppose if I had been really good I might have taken a photograph of the display. I can tell you that there were two subspecialisation, mainly one on wedding flowers and one on wedding cakes. The rest were things like Bride, or Bridal Magazine. There was a surfeit of white. It was a bit overwhelming.

When I posted this to twitter, a couple of things happens. Someone knew there was a bridal show on at the RDS – news to me – and then this.

Damien Mulley told me there were approximately 21,000 weddings in the country each year.

Paul Savage told me that according to Facebook, 78,000 people were engaged.

Damien Mulley came back and noted that according to Facebook, 42,000 of those were female, aged 20 or older.

You can have a look at the conversation here.

The average circulation of the general Irish fashion mags like Image and Irish Tatler is around 25,000. I’m having serious problems getting any wider circulation figures and this distresses me – the JNRS is coming back at me with newspaper and newspaper related circulation figures. But no magazines.

I can pick up some of the advertising rate cards for the Ireland based magazines and I can tell you that for one of them, the bulk of their readership is in the 25-34 age bracket.

But actual circulation figures, the magazines in Ireland appear to be very coy about.

In one respect, it might be an interesting exercise to:

  1. figure out what the picture of bridal magazines in Ireland has been for the last 15 years or so. Have we always sold 13 different magazines? What is the market entry and exit rate for them
  2. Figure out how many of them are selling every month. The cover price rate is somewhere in the region of around 5E.
  3. Figure out some way of comparing their advertising rate cards which are not uniform across the different charges.
  4. Figure out how they compare to the other women’s interest segment magazines.

Why am I interested in this? Well deep down I am wondering whether Ireland can sustain that many bridal magazines when it’s already having trouble sustaining its broadsheet newspapers. I’m also interested in seeing whether weddingsonline.ie has had an impact on the market in any indirect or direct way.

And of course, part of me is wondering about market segmentation in the glossy magazine market. Ireland has a population of around 4.5 million. It’s not, by any stretch of the imagination a huge market. This is not just limited to the whole bridal magazine thing – we also produce a couple of other specialist interest magazines, the sales of which are also augmented by imports from the UK and in some cases, the US.

Finally – the comments from Paul and Damien when I discussed this on twitter the other day were interesting because it shows that some ballpark information regarding the possible target cohort of this particular market segment could be obtained from other, social, sources.

So basically, if any one has any idea how I might get granular circulation data to play with for all magazines on sale in the Irish market at the moment, I might be interested in setting some time to have a flute around it.

Care.data

If you’re in the UK at all, you may have heard of some discussion around something called care,data. The general idea about it is that all healthcare data is centralised and that this repository of data would be made available to researchers. Such a repository of data would be massively useful for healthcare researchers.

So far so good. As someone with a great deal of interest in data, and how it can be best used to advance human society, you’d think I’d be wild about this idea. I’m not wild about the implementation and this is a pity.

The data, we are told, will be pseudoanonymised. This is the number one problem I have with it – it’s not actually properly anonymised. It comes with postcode data and NHS number. In the UK, postcode data can in a lot of cases be personally identifiable. This is wrong.

This is before you start asking questions about who gets to use the data. Plus, given the changes to the NHS organisation in the UK courtesy of the current government, you’d have to ask whether the data is even going to be as useful as it might have been 10 years ago under a centralised system.

So okay, I can knock it and be concerned. But I do believe something akin to it would be useful. Not necessarily directly profitable, but useful. So how could we implement it?

Well, there’s no reason why we can’t, straight out, why postcode is relevant? It provides regional variation information. So one of the things we need to do is provide geographically classified data. Using postcodes to create a geographic classication which does not include the postcode itself is, or should be, straightforward enough. Ergo, the postcode issue can be dealt with.

The NHS number can be replaced with a different primary key number which is not made available as part of the database of care,data data, but for which a conversation table exists with the original data. Again, depending on the actual implementation of the data structures, this should be straightforward.

This deals with the data privacy side of things and one of the big huge issues I have with the current idea.

After that, we need to be aware that more data doesn’t always cater for better/more accurate detailing. Large datasets can amplify statistical errors which, given we are talking about health data sets matter a lot, They affect real people.

These errors are the type of errors where, for example, 1 in 100 cases might be misdiagnosed because a particular test isn’t 100% acccurate for example.

Ultimately, I’m strongly in favour of this project, or, more to the point a project like it, provided it comes with built in data protection concerns and is implemented to benefit health care rather than, for example, corporate health business interests. As matters stand, I’m inclined to feel that there are lacunae here at the moment.


SNCF Hackathon Transilien

SNCF, the French national rail company, ran an open data hackathon last weekend. I didn’t know about it in advance and anyway the schedule at the moment was such that there was no way I could have made it without a lot more notice but it struck me as interesting that they did it.

You can find the SNCF’s open data page here. Transport for London do something similar and I’ve seen some very interesting map projects come out of that. I’ve also plaintively wailed for similar access to Dublin Bus’s data.

There’s a lot of things different people can do with different data and they don’t always work for your company. I think it’s interesting to see the transport companies doing something, and some very interesting stuff has been done with available data in the aviation sector too (Flight Radar 24 is a key example).

However, I hadn’t come across a company actually running an open hackathon on their data so this weekend’s event in Paris – it focussed on transilien services which is commuter rail in the Ile de France area around Paris – was an interesting development. I’d keep an eye open for similar events and try to get there in the future if I can hang the small details together.


Ben Schneiderman’s 8 Golden Rules of Datascience

This popped up in my twitter feed today – it’s a photograph of a slide from a talk given by Ben Schneiderman. I’m not sure I’d call them golden rules per se, but they are definitely a very decent framework to follow:

Preparation

  • Choose actionable problems and appropriate theories
  • Consult domain experts and generalists

Exploration

  • Examine data in isolation and contextually
  • Keep cleaning and add related data
  • Apply visualization and statistics: patterns, clusters, gaps, outliers, missing and uncertain data

Decision

  • Evaluate your efficacy, refine your theory
  • Take responsibility, own your failures
  • World is complex, proceed with humility.

Professor Schneiderman’s home page is here. The link to the tweet I picked all this up from is here via Kirk Borne and Seth Grimes

Changing times…

Via Damien Mulley’s fluffy links the other day I found myself perusing the Irish Motor Directory and Motor Annual 1911-1912 late last night. The directory itself can be found here, hosted by Lurgan Ancestry and while we’re at it, a shout out to My Kerry Ancestors who are talking about this link too. Okay, that’s the commercials out of the way.

I decided to see from it who was the first person in the “I come from a small, small” town where I grew up to register a car, and glanced down through the list looking at the addresses.

The first owner registered in the town where I grew up was my great grandfather, and it looks like he registered a motorbike. My mother is stunned, but was pretty certain that it was him, so I went to the 1911 census to check who of the relevant surname was living on the street concerned at the time, and by process of very simple elimination confirmed that yes. the named owner in question was her grandfather. In 1911, he was 27.

So I could write a bit about the family background but this is a data/tech blog and actually I’m going to write about changes in society.

If you have a look at the Lurgan website above, it’s actually interesting in the questions it leaves unanswered.

  • The register classifies vehicles by type – car, charabanc, bicycle, tricar, steam car, steam lorry, dogcart, steam plough. It would be enthralling to know who manufactured these things.
  • The register provides the registration numbers and some address information.
  • The addresses are interestingly diverse – for example, because I grew up in Cork, I was looking at the IF register – but a number of the addresses are in Dublin and the UK, for example.
  • in 1911-1912, there are 239 cars and 146 bikes registered in Cork, but the highest registration number is IF 434 as far as I can see. So I’m interested to see what the gaps are.
  • There are county and borough register authorities – I don’t know enough about local government organisation in Ireland in the early 20th century (but then, who does?)
  • this document was a reference handbook for motorists. So it was openly available.

That last bit is the bit that interests me. Any motorist in Ireland could have had a list of all the car owners in Ireland, known their names and where they lived, sorted by registration number. This doesn’t happen today and I don’t know if it could. I just googled my own car reg and Motorcheck came up with a background check for the car – but it will not give any personal details about the owner of the car or the address at which they live.

The Reference book for 1911-1912 suggests that there are 9169 vehicles listed in it, split slightly in favour of cars. Registrations would have started in 1903 when the registration system was implemented first (citation – Wikipedia but I don’t think there’s much arguing here). The series for Cork, IF, started being used in 1903 and eventually ran out in 1935. The number/index letters were reversed and used again later between 1975 and 1976. So the only conclusion that I can draw about my grandfather’s bike is that it was registered at some stage between 1903 and 1911, and the likelihood, I suspect, closer to 1903 than 1911 based on the numbers.

For comparison,  86,932 new cars were registered in Ireland in 2012. (Summary of Statistical Yearbook of Ireland, 2012). The 1911-1912 Reference Book was compiled by Henry G. Tempest and given the available communications options, it’s fair to say that to compile and print that information for over 9,000 vehicles was an achievement but I couldn’t see him doing it for nearly 90,000 new cars, never mind all the cars still on the road from prior to 2012.

And times have changed. We are more concerned about personal data. For years, people have been applying their right not to be listed in the phone directory, and I’m not sure anyone would want their address details along with details about their car in any easily accessible database for various reasons including, no doubt, not wanting to have their movements identified too easily, or not being easy prey for thieves.

Of course, I wouldn’t be me if I wasn’t thinking of ways I could analyse this data in more detail and wondering what other extraneous data sources could be used to enhance it (and not just, for example, the 1911 census).


Property Price register in Ireland…

I’ve started looking at the possibility of doing something with the data released by the Irish government on the subject of property prices in Ireland.

This is something which really only started happening in the last few years, and in fact, it started happening well after the property market in Ireland had started to collapse. The first year for which we have data is 2010.

In general terms, I think it is a good thing that we have this data available but there are ways in which it could be enhanced, I think, which would make it more useful.

As far as I am aware, data for the Irish Property Price register comes from stamp duty returns

Currently, the data headers are as follows:

  • date of sale
  • Address of property
  • postal code
  • County
  • Price in euros
  • Not Full Market value (yes or no – in this case YES means it was not full market value)
  • VAT Exclusive (yes or no)
  • Description (New Dwelling House/Appartment or Secondhand dwelling house/appartment)
  • Property size description (greater than 125 sqm, greater than or equal 38 sqm and less than 125 sqm, less than 38 sqm)

As things stand, there is very little useful information about the properties in the register that allow us to do anything particularly interesting.

  • Data can be downloaded a county level. The county column is otherwise not useful to an end user
  • The postal code field is currently inapplicable for most of the country and for Dublin, it is not always filled in because the postal code has been integrated with the address
  • date of sale is useful
  • price of property is useful
  • full market value or not is useful
  • VAT exclusive is useful
  • property description only informs us whether the property is new or second hand. It does not tell us the type of property
  • property size would be more useful if the bin ranges were more granulated.

Nevertheless I have plans for this data but only within the confines of the possible.

However, one of the things I would consider is how could we make this better for the future?

  • postcodes are coming for the entire country. I have yet to look at the implementation (soon) but this could be very useful in terms of segmenting the market, provided they are entered in the correct field.
  • No estate agent describes a property as a new or second hand dwelling house/apartment. DAFT, for example, drills down house, apartment, duplex, bungalow. Arguably to that we could add detached, semi detached, terrace (or town house or whatever you’re having yourself for houses bounded on both sides). Put simply, for type of property, there isn’t enough information.
  • Additional column for new or secondhand dwelling
  • Accurate surface area measurements. At this point I need to note that from experience, in other countries, surface area is more important in ads and classifiers to the numbers of bedrooms and bathrooms. I would like it if a) it was mandatory to provide surface area measurements in property sale/rent ads and that this information gets included in the property price registry.

There are a few benefits here. Price per square meter is a useful indicator of value across different areas (which might be more definable with valid postcodes). We can also get a picture of which are are bigger houses (I have plans to look into what I can find on the subject of surface area measurements against time at some stage too).

Our property market now is very different to what it was in 2007, but also compared to what it was in 2000, and in 1993. We built a lot of apartments in later years which makes comparing averages very difficult and fraught with danger.

According to the data I have available to me right now, up to 7 October or so, there have been 5943 sales in the Dublin area. In comparison, for the whole of 2012, there were 8808 sales based on a superficial glance at the data.

I will be having a look at this in more detail and will post the outcome in the future and I will also put the code up on github.

In the meantime, it would be nice if we could consider getting past “we have a register” and on to the question “how can we make it even more useful”.


Analytics Club – data analytics in Dublin on a Tuesday night

I found out quite by accident a week or two ago that there were occasional data analytics meet ups in Dublin city centre so I resolved to go along to the next one and found myself downstairs in a city center bar I’d never noticed before. The evening is run under the auspices of CeADAR and the DIT data analytics course with a few blowins like myself. It was quite an interesting event. There were three talks – one on PowerPivot which may or may not be interesting to you; one on datamining Dail questions since independence and specifically a comparison between local questions and national policy questions which raised a few comments, and then one final piece on the question of public policy and big data. It was followed up briefly by a panel discussion.

What surprised me about the event is that it was quite well attended for something which I figure can be quite esoteric, until I realised it was supported by a specific data analytics course in Dublin Institute of Technology. Input from CeADAR guaranteed some presence from UCD as well.

CeADAR is quite new in Ireland – it was launched on 15 March and it’s driven pretty much by UCD with some partnership from UCC and DIT. Looking at their education page is quite interesting…I would be hoping to see more datascience courses coming on stream. I know, for example that DCU has an analytics major coming with one of their Masters courses next year.

Back with the bash on Tuesday night, they are listed on Meetup and the next one will probably be in September. If you’re interested in data analytics or data science in Dublin, it may be worth a look.

Datagraphics: the property tax in Ireland.

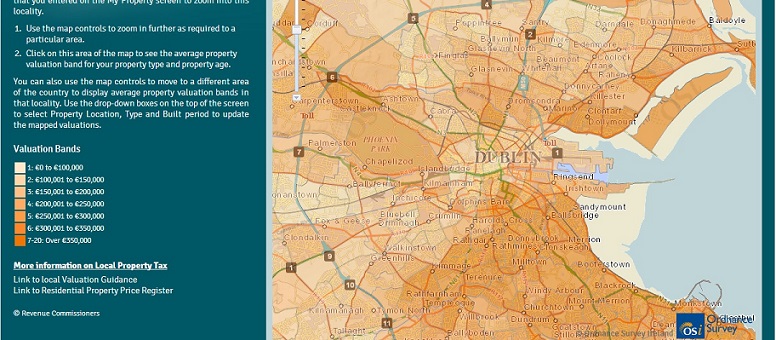
According to the Irish Times, the Revenue Commissioner’s guideline map for property values (for self assessment for the property tax we now have) has drawn a lot of criticism, mainly of the type “the values they are suggesting do not match reality on the ground”. See this report here.

I’m not, for now, going to go into any great detail on data quality and assessment of same. There are a lot of arguments to be had over that.

My issue is the map itself. Here, roughly speaking, is what it looks like (screengrabbed at 7pm) on my computer:

Dublin City area property tax valuations
Dublin City - property values


I firmly believe that a graphic like this should be easy to read. This one isn’t because the graduations between the different colours is very slight so that it can be hard to identify exactly which of two bands a particular area falls into.

If I were doing something like this, I’d take bigger colour differentials for the different bands rather than a graduated scheme as used above.